The Cash Projection Report graph application facilitates Elliott reporting features by plotting the anticipated future
revenue outlook of your organization. It processes information obtained from
the A/R Open Item File, and creates a report that projects the amount
each customer account will contribute to the overall projection within a given
period of time. This resource can provide a powerful visual representation of
important business variables such as the comparative amount of anticipated
future gross receipts generated by your most valued customers. It can also be
used as a tool to set organizational goals, and plan future resources.
You can create a report that projects cash receipts
generated in any combination of the following variables.
A range of customers
Projected cash receipts to be generated by a
specified date.
A Period of time that you define.
Projected cash receipts based on
the current amounts generated in a given period, Year to date or both of these
variables.
You may also choose to calculate the Projected Revenue based
on the invoices' due dates or the customers average number of days to pay
during the current year. If one or more of your customers have a tendency to
pay early or late, basing the report on average days to pay can provide a more
realistic picture of when to expect cash receipts.
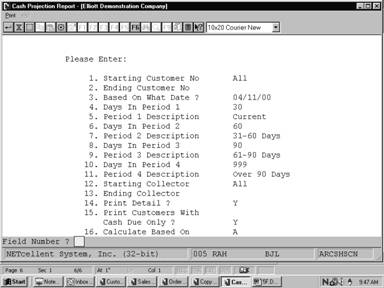
Select Cash Projection Report from the pull down A/R
Reports window. The following screen will then be displayed:
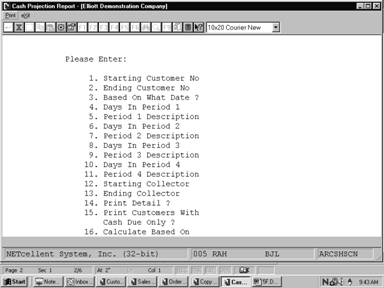
Cash Projection Report
Entry Screen
After entering the required information another window will
display the following options.
8
Print the cash projection report by customer, by collector, based
on a certain date, in detail or summary with cash due from customers or all
customers.
To return to the menu bar, press the ESC or F10
key. To leave this application, press X for EXIT when positioned
at the menu bar.
Entry Field Descriptions
|
Name
|
Type
and Description
|
|
1.
Starting Customer No
|
6
alphanumeric characters.
Enter
the starting customer number, in the range that you want to plot.
If
you press RETURN for the entry of the starting customer, the field
will default to All customers, and the ending customer will be
skipped.
|
|
2.
Ending Customer No
|
6
alphanumeric characters.
Enter
the ending customer number in the range you want to plot.
|
|
3.
Based On What Date ?
|
A
date In the standard date format.
Enter
the future date that you want to forecast projected cash receipts.
This
field automatically defaults to the present date.
|
|
4.
Days In Period 1
|
3
numeric characters.
This
field automatically defaults to the predefined settings in you’re a/R
Setup.
For
the purpose of this graph you can enter a different number of days to be
considered in Period 1.
|
|
5.
Period 1 Description
|
8
alphanumeric characters.
This
field automatically defaults to the predefined settings in you’re a/R
Setup.
You
may substitute this with the description entered here. This information will
appear when the resulting graph is printed.
|
|
6.
Days In Period 2
|
3
numeric characters.
This
field automatically defaults to the predefined settings in your A/R Setup.
For
the purpose of this graph you can enter a different number of days to be
considered in Period 2.
|
|
7.
Period 2 Description
|
8
alphanumeric characters.
This
field automatically defaults to the predefined settings in your A/R Setup.
You
may substitute this with the description entered here. This information will
appear when the resulting graph is printed.
|
|
8.
Days In Period 3
|
3
numeric characters.
This
field automatically defaults to the predefined settings in your A/R Setup.
For
the purpose of this graph you can enter a different number of days to be
considered in Period 3.
|
|
9.
Period 3 Description
|
8
alphanumeric characters.
This
field automatically defaults to the predefined settings in your A/R Setup.
You
may substitute this with the description entered here. This information will
appear when the resulting graph is printed.
|
|
10.
Days In Period 4
|
3
numeric characters.
This
field automatically defaults to the predefined settings in your A/R Setup.
For
the purpose of this graph you can enter a different number of days to be
considered in Period 4.
|
|
11.
Period 4 Description
|
8
alphanumeric characters.
This
field automatically defaults to the predefined settings in your A/R Setup.
You
may substitute this with the description entered here. This information will
appear when the resulting graph is printed.
|
|
12.
Starting Collector
|
3
alphanumeric characters.
Enter
the starting collector number, in the range that you want to plot.
If
you press RETURN for the entry of the starting collector, the field
will default to All collectors and the ending collector will be
skipped.
|
|
13.
Ending Collector
|
1
alphabetic character.
Enter
the ending customer number in the range you want to plot.
|
|
14.
Print Detail ?
|
Y or N.
Enter
Y to see all customer detail, otherwise a summary will print.
|
|
15.
Print Customers With Cash Due Only ?
|
Y or N.
Enter
Y to see only the customers that have open invoices that are expected
to be paid.
|
|
16.
Calculate Based on ?
|
1
alphabetic character.
Valid
entries are:
A = Customer
Average Days To Pay
B = Document
Due Date
Enter
A to calculate projected revenue based on each customer's average days
to pay during the current year. If customers tend to pay their bills early
or late, this option can provide a more realistic idea of when to expect cash
receipts. Enter B to calculate projected revenue based on the due
date for each document in the Open Item file.
This
field defaults to A.
|