 |
|
Labor Performance ReportApplication OverviewThe Labor Performance Report prints the productivity of each selected operator. The operator’s time is categorized into 4 types: productive, non-productive, break time (payable break) and meal break time (non-payable break). For example, an operator reports for a production department for 9 hours. Seven hours are productive, 0.8 hours are non-productive, 0.2 hours are for a break and 1 hour is for a meal break. The report sums up the hours of each category for a period of time, which can be a day, a month, a year, etc.
The report prints a percentage or ratio of each type of time. The productive hours and non-productive hours are added to give total work time and the percentage of productive and non-productive hours are calculated based on this total work time. Break time and meal break time are compared to total work time for their respective ratios. Based on these percentages and ratios you can get an idea of how much time an operator spent on productive and non-productive activities.
Select operators by a range of operator departments, shifts and operator ID’s. Different levels of detail can be printed, such as yearly, monthly, daily or for each session. In addition, the performance data can be exported to a CSV file.
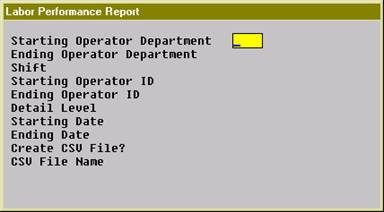
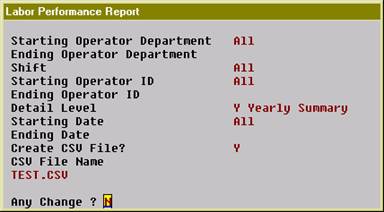
The WO+ Time Clock system must be used to gather labor hours for this report. Run InstructionsMain Menu è Distribution è Bill of Material Processor è Reports è Production Analysis Report è Print è Labor Performance Report.
(Figure 64) Labor Performance
Entry Field Descriptions
(Figure 65) WIP Variance Report
(Figure 65) WIP Variance Report
Production Hours Variance ReportApplication OverviewThe Production Hour Variance Report prints a selected range of operators and their efficiency for a period of time. The efficiency is based on the hour variance by comparing planned hours for each work order and actual hours. If the operator worked faster than expected, the variance would be positive. This report can be used to further analyze the productive hours of an operator.
The report can be sorted by operator or work center. When sorted by operator, the sorting sequence is the operator department, shift and operator ID. The overall production hour variance of each individual will be printed, no matter where the operator was working. On the other hand, selecting to sort by work center will make the sorting sequence by work center department, work center, shift and operator ID. Then the hour variance of an operator will be printed for each work center.
Various detail levels can be printed: department summary, work center summary, shift summary, operator summary and production detail. You can select a range of operators by Operator ID, shift and department ID. When it is sorted by work center, you can select a range of work centers as well. Also, you can select a range of production finished dates.
The report separates labor hours into direct labor and shared labor. Direct labor is the labor directly reported for the work order and is required to report production. Shared labor does not need to report production and the time is shared with the work order.
When multiple workers collaborate on the same work order, the planned hours will be divided by each operator. For instance, the planned hours for a work order is 4 hours and it takes 6 hours to finish it. One operator worked for the whole 6 hours and another operator joined in the last 2 hours. The Planned Hours for the first operator is 3 hours and Actual Hours is 6 hours, so the variance is 3 hours. The Planned Hours for the second operator is 1 hour and Actual Hours is 2 hours, so the variance is 1 hour. This only occurs with shared labor.
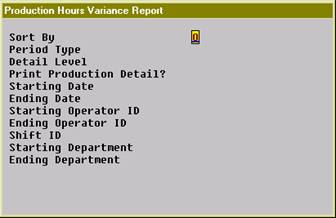
Because this report needs information about each operator, you must use the WO+ time clock system to gather the required data. Run InstructionsMain Menu è Distribution è Bill of Material Processor è Reports è Production Analysis Report è Print è Production Hours Variance Report
(Figure 67) Production Hours Variance Selection Screen
|
|
Name |
Type and Description |
|
Sort By |
1 alphanumeric character.
Valid entries are: O - By operator. The sort sequence is operator department, shift, and operator ID. W - By work center. The sort sequence is work center department, work center, shift, and operator ID. This provides a break down of hour variance by work center. Enter the sorting sequence for the report.
Defaults to O. |
|
Period Type |
1 alphanumeric character
Valid entries are: Y - Yearly M - Monthly D - Daily Enter the length of each period of time to evaluate in the report.
Defaults to Y. |
|
Detail Level |
1 alphanumeric character
Valid entries are: O - Operator Summary. S - Shift Summary. W - Work Center Summary. This option is only valid if the report is sorted by work center. D - Department Summary. When the report is sorted by Operator, this is Operator’s Department. Otherwise, this is the Work Center’s Department. Enter the detail level you want to print on the report.
Default to D |
|
Print Production Detail? |
Y or N.
Enter Y to print hour variance for each production.
Defaults to N. |
|
Starting Date |
Standard date format.
Enter the starting date for a range of finish dates.
Defaults to All. |
|
Ending Date |
Standard date format.
Enter the ending date for a range of finish dates.
Defaults to the starting date. |
|
Starting Operator ID |
10 alphanumeric characters.
Enter the starting operator ID for a range of operators to print. Press the F7 Key to search for an existing operator ID.
Defaults to All. |
|
Ending Operator ID |
10 alphanumeric characters.
Enter the ending operator ID for a range of operators to print. Press the F7 Key to search for an existing operator ID.
Defaults to the starting operator ID. |
|
Shift ID |
2 alphanumeric characters.
Enter the shift ID of operators to print on the report. Press the F1 Key to select operators without a shift ID. Press the F7 Key to search for an existing shift ID.
Defaults to All. |
|
Starting WC/Oper Department |
4 alphanumeric characters.
Enter the starting department ID for a range of departments to print on the report. When the report is sorted by operator, the department is the home department of the selected operators. When the report is sorted by work center, the department is the department of the selected work centers. Press the F7 Key to search for an existing department ID.
Defaults to All. |
|
Ending WC/Oper Department |
4 alphanumeric characters.
Enter the ending department ID for a range of departments to print on the report. Press the F7 Key to search for an existing department ID.
Defaults to the starting department ID. |
|
Starting Work Center |
6 alphanumeric characters.
Enter the starting work center ID for a range of work centers to print on the report. This selection is only available if the report is sorted by work center. Press the F7 Key to search for an existing work center ID.
Defaults to All. |
|
Ending Work Center |
6 alphanumeric characters.
Enter the ending work center ID for a range of work centers to print on the report. This selection is only available if the report is sorted by work center. Press the F7 Key to search for an existing work center ID.
|
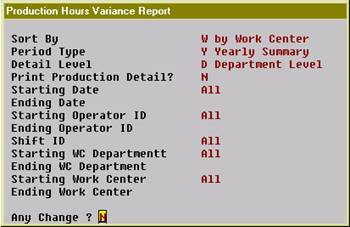
(Figure 68) Production Hours Variance Selection Screen
|
P R O D U C T I O N H O U R S V A R I A N C E Y E A R L Y S U M M A R Y R E P O R T
Sort by Work Center, Detail to Department Level Range: All Department All Work Center All Shift All Operators All Dates
------------Direct-Labor------------ ------------Shared-Labor------------ ----------------Total--------------- Dept Year Plan-Hrs Complete Variance Var% Plan-Hrs Complete Variance Var% Plan-Hrs Complete Variance Var%
CNC 10 0.00 0.00 310.14 331.18 21.04- 6.78-% 310.14 331.18 21.04- 6.78-%
GEN 10 1310.00 1298.44 11.56 0.88 % 109.00 148.94 39.94- 36.64-% 1419.00 1447.38 28.38- 2.00-%
@@@@@@@@@@@@@@@@@@@@@@@@@@@@@@@@@@@@@@@@@@@@@@@@@@@@@@@@@@@@@@@@@@@@@@@@@@@@@@@@@@@@@@@@@@@@@@@@@@@@@@@@@@@@@@@@@@@@@@@@@@@@@@@@@@@@@@@@@@@@ Grand Total: 1310.00 1298.44 11.56 0.88 % 419.14 480.12 60.98- 14.55-% 1729.14 1778.56 49.42- 2.86-% @@@@@@@@@@@@@@@@@@@@@@@@@@@@@@@@@@@@@@@@@@@@@@@@@@@@@@@@@@@@@@@@@@@@@@@@@@@@@@@@@@@@@@@@@@@@@@@@@@@@@@@@@@@@@@@@@@@@@@@@@@@@@@@@@@@@@@@@@@@@
|
(Figure 69) Production Hours Variance Report