|
|
ABC Analysis ReportsApplication Overview
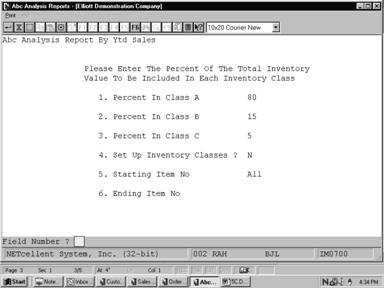
The ABC Analysis Reports application allows you to print a report that shows the inventory in descending order by year‑to‑date usage dollar cost, year-to-date sales dollars, usage dollar cost year‑to‑date, or year-to-date dollar margin (dollar sales ‑ dollar cost). The report also categorizes the items according to percentage figures you enter for inventory classes A, B and C. As an option, you may have the inventory classes in your Inventory Item File set according to the results of this report.
At the end of the report, a summary is printed according to the suggested inventory classes calculated based on your entered percentages.
Run Instructions
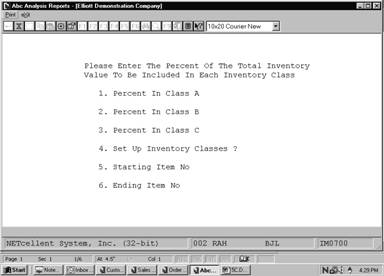
Select ABC Analysis Reports from the pull down I/M Reports window. The following screen will then be displayed:
ABC Analysis Report Entry Screen
The following options are available:
* Select the desired mode from the Abc Analysis Reports menu bar * Enter the data requested on the screen To return to the menu bar, press the ESC or F10 key. To leave this application, press X for EXIT when positioned at the menu bar. Entry Field Descriptions
ABC Analysis Report By YTD Usage
ABC Analysis Report By YTD Sales
ABC Analysis Report By YTD Cost
ABC Analysis Report By YTD Margin
A B C A N A L Y S I S R E P O R T
Analysis By Ytd Cost Class A: Top 80% Class B: Next 15% Class C: Bottom 5% Of Total Inventory Cost
Item No Description Units Sold Cost Ytd ‑‑Inv Class‑‑ Cost Ytd Ytd Pres Sugg Sub‑Total
PC‑386 386 Personal Computer 765.00 1,502,031.87 C A 1,502,031.87 Customize During Order Entry
PC Parent Item (Mother Board) .00 57,936.75 C B 1,559,968.62 Personal Computer
16SX‑3 Personal Computer 386SX 20.00 25,900.00 A C 1,585,868.62
16SX‑1 Personal Computer 386SX 8.00 13,180.00 A C 1,599,048.62 Kit No1
16SX‑2 Personal Computer 386SX 22.00 11,644.80 A C 1,610,693.42 Kit No2
ETHERNET Ethernet Kit 104.00 2,662.40 A C 1,613,355.82 Kit #16
CPU Mother Board For Parent 1.00 2,103.49 A C 1,615,459.31 Central Processing
A B C A N A L Y S I S R E P O R T
Analysis By Ytd Margin Class A: Top 80% Class B: Next 15% Class C: Bottom 5% Of Total Inventory Margin
Item No Description Units Sold Cost Ytd Dollarized ‑Inv Class‑ Dollarized Margin Ytd Sales Ytd Margin Pres Sugg Sub‑Total
PC‑386 386 Personal Computer 765.00 1,502,031.87 517,936.03 C A 517,936.03 Customize During Order Entry 2,019,967.90
16SX‑3 Personal Computer 386SX 20.00 25,900.00 3,540.00 A C 521,476.03 29,440.00
16SX‑2 Personal Computer 386SX 22.00 11,644.80 1,731.20 A C 523,207.23 Kit No2 13,376.00
ETHERNET Ethernet Kit 104.00 2,662.40 275.86 A C 523,483.09 Kit #16 2,938.26
INPUT/OUT Subassembly Component 2.00 427.96 17.24 C C 523,500.33 I/O Board For Computer 445.20
BOX‑386‑1 Basic SM Box w/7 Exp 6‑16 1‑8 .00 .00 .00 A C 523,500.33 .00
BOX‑386‑2 Adv Box HDps 8 Exp 32 5‑16 2‑8 .00 .00 .00 C C 523,500.33 .00
|