This application
gives you the capability of evaluating the performance of particular vendors,
as well as comparing the performance of one vendor with another. The report
shows such information as the vendor's last activity date, the number of orders
you have submitted during the year, the value of purchases this year and last
year, the number of purchase order lines for the year and the number of lines
that were late. The report also provides several comparison percentages that
give you a very clear idea of the vendor's ability to deliver quality products
at the expected cost and on time. These percentages include the percentage of
purchase order lines that were late this year and last, the percentage cost
variance between expected and billed costs and the percentage of delivered
items that were rejected. Finally, the report presents two averages: the
average lead time and the average number of days late.
The report may be
printed for a range of vendor numbers and for one or all commodity codes. The
report will selectively disregard vendors with a last activity date that is
earlier than a date that you specify.
Perhaps the most
powerful feature of this application is the capability it provides of showing
vendors that fall within a range of performance characteristics that you
specify. For instance, you can show all vendors that have had less than 10%
lines late, less than 5% cost variance and less than a 7% rejection rate. Or
you can focus upon desirable vendors by specifying that only those with a
rejection rate greater than 20% and a cost variance percent greater than 10% be
shown. You will probably find the report most useful when you use it to
compare vendors that provide a particular commodity. A buyer or department
manager can determine what kind of service his vendors have been providing and
then seek other vendors if he finds the level of service to be unsatisfactory.
A buyer could also use these statistics as leverage for acquiring better
service, prices or terms from a vendor who has been operating below par. This
information can be valuable to anyone in your organization who deals with
vendors and particularly valuable to those who have responsibility for
selecting vendors.
Select
Vendor Performance Analysis Report from the pull down P/O Reports window.
The
following options are available:
* Select
the Print mode from the Vendor Performance Analysis Report menu bar
* Enter
the data requested on the screen
* Answer
Y to the question asking if you wish to restrict by percentages, a second
screen will display upon which you specify which percentages apply and what
their amounts are.
* The
report then prints.
To
return to the menu bar, press the ESC or F10 key. To leave this application,
press X for EXIT when positioned at the menu bar.
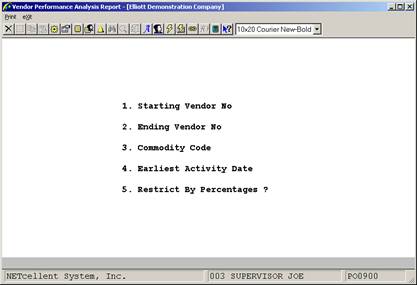
Entry Field Descriptions
Range Screen
|
Name
|
Type
and Description
|
|
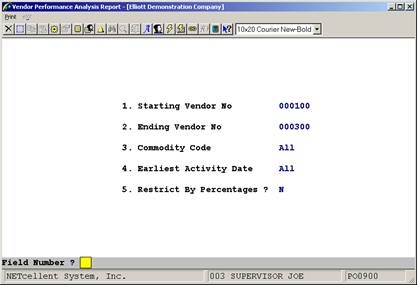
1. Starting Vendor No
|
6
alphanumeric characters.
Enter the first vendor in
the range of vendors that are to be considered for inclusion on the report.
The number need not be that of a vendor on file in the Vendor file.
Press the F7 key to search
by vendor number.
Press the F8 key to search
by vendor name.
Defaults
to ALL.
|
|
2. Ending Vendor No
|
6
alphanumeric characters.
Enter the last vendor in the
range of vendors that are to be considered for inclusion on the report. The
number need not be that of a vendor on file in the Vendor file.
Press the F7 key to search
by vendor number.
Press the F8 key to search
by vendor name.
Defaults
to the starting vendor number.
|
|
3. Commodity Code
|
4
alphanumeric characters.
Enter the commodity code for
which the vendors who are included on the report are suppliers. Only those
vendors who fall within the range of starting and ending vendor numbers and
who provide this commodity will be shown.
Defaults
to All.
|
|
4. Earliest Activity Date
|
A
date in the standard date format.
This activity date refers to
the vendor's last activity date. You can selectively ignore those vendors
who have not had recent activity by means of the date that you specify.
Enter the earliest last activity date which will quality a vendor for
inclusion on the report.
Defaults
to All.
|
|
5. Restrict by Percentages
?
|
Y or
N.
Answer Y if you wish to
advance to the second screen, where you can enter additional parameters that
pertain to performance statistics. The second screen has no effect upon
which data prints for individual vendors but it does affect which vendors
will show up on the screen.
Answer N if you do not wish
to qualify by their performance statistics the vendors that are to appear on
the report.
Defaults
to N.
|
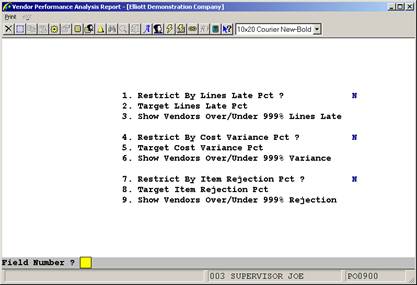
Percentages Screen
|
Name
|
Type
and Description
|
|
1. Restrict by Lines Late
Pct ?
|
Y or
N.
Lines Late refers to those
purchase order line items for which the merchandise was received later than
it was requested. Line items that are canceled because of delays shipment
are also considered to be late for purposes of this statistic.
The
lines late percent is the ration (expressed as a percentage) between the
number of lines late and the total number of purchase order line items that
were ordered from the vendor.
|
|
Restrict by Lines Late Pct ?
(continued)
|
Answer
Y if you wish to qualify a vendor for inclusion on this report by his
percentage of lines late. If you answer Y, you will be allowed to enter the
next two fields. If you answer N, the program will advance to entry of the
fourth field.
Defaults
to N.
|
|
2. Target Lines Late Pct
|
3
numeric digits (999).
Enter the percentage of
lines late that will be used for determining whether a vendor shows up on the
report or not. The program will use your entry for this field in conjunction
with your entry for the next field to qualify vendors.
Defaults
to zero.
|
|
3.
Show Vendors
Over/Under 999% Lines Late
|
1
alphabetic character.
O or U. A submenu will
display to remind you of the valid options.
Enter
O if you wish to show only those vendors who percent lines late is over the
target percent entered in #2 above. Enter U if you wish to show those vendors
whose percent is under the target percent.
|
|
4. Restrict by Cost
Variance Pct ?
|
Y or
N.
A cost variance is the
difference between the price at which you ordered something and the price at
which you were billed for it. Generally you are concerned if the vendor
consistently charges more for what you order than your purchase order
specified. You might also be interested in seeing those vendors who charge
less.
Defaults
to N.
|
|
5. Target Cost Variance
Pct
|
3
numeric digits (999).
Enter the cost variance
percentage that will be used for determining whether a vendor shows up on the
report or not. The program will use your entry for this field in conjunction
with your entry for the next field to qualify vendors.
Defaults
to zero.
|
|
6. Shows
Vendors Over/Under 999% Variance
|
1
alphabetic character.
O or U. 999% Variance A
submenu will display to remind you of the valid options.
Enter
O if you wish to show only those vendors whose percent cost variance is over
the target percent entered in #5 above. Enter U if you wish to show those
vendors whose percent is under the target percent.
|
|
7. Restrict by Item
Rejection Pct ?
|
Y or
N.
Answer Y if you wish to
qualify a vendor for inclusion on this report by his rejection percentage.
If you answer Y, you will be allowed to enter the next two fields.
Defaults
to N.
|
|
8. Target Item Rejection
Pct
|
3
numeric digits (999).
The rejection percentage is
the ratio between the number of items that were rejected and the number of
items that were received. A high rejection rate indicates low‑quality
products or careless packing or an inability on the vendor's part to ship
precisely what was ordered.
Enter the rejection percent
that will be used for determining whether a vendor shows up on the report or
not. The program will use your entry for this field in conjunction with your
entry for the next field to qualify vendors.
Defaults
to zero.
|
|
9. Show Vendors Over/Under
999% Rejection
|
1
alphabetic character.
O or U. A submenu will
display to remind you of the valid options.
Enter
O if you wish to show only those vendors whose rejection percent is over the
target percent entered in #8 above. Enter U if you wish to show those vendors
whose percent is under the target percent.
|
 3
3
Vendor Performance Analysis
Report
 2
2
Vendor Performance Analysis If
Restricted By Percentages
Run Date: Oct 26, 2001 - 5:43am Elliott
Demonstration Company
Page 1
V E N D O R P E R F O R
M A N C E A N A L Y S I S R E P O R T
Range: All
Vendors
All Commodity
Codes
All Activity
Dates
Vendor Vendor-Name Telephone-No
Activ-Date Ytd-Purchases Ytd-Lines Pct-Lns-Lte Pct-Cost-Var Avg-Lead-Time
No
Ytd-Orders Purchases-Lyr Ytd-Late Pct-Lte-Lyr Pct-Rejected Avg-Days-Late
000100 Computer Electronics Center 213-723-8377
10/18/01 1,700.00 0 .00 11.23 17.98
0 .00 0 .00 1.29 3
000200 CompuPart Computer Services 834-834-8388
09/10/89 .00 0 .00 5.23 7.83
0
.00 0 .00 .09 2
000300 Anawalt Computer Company 213-823-8238
09/17/89 .00 0 .00 6.23 4.00
0 .00 0 .00 2.22 0
000400 Computers of America 213-823-3000
10/17/89 .00 0 .00 .00 .00
0
.00 0 .00 .00 0
000500 Ronson Electronics 213-827-7333
09/15/89 .00 0 .00 .00 .00
0 .00 0 .00 .00 0
000600 Maintenance Electronics 432-3424
10/14/91 .00 0 .00 .00 .00
0 .00 0 .00 .00 0
000700 Southern Electronics 213-888-5555
02/18/92 5,000.00 0 .00 .00 .00
0 .00 0 .00 .00 0
000800 Allied Electronics Company 213-555-7878
09/17/89 .00 0 .00 .00 .00
0 .00 0 .00 .00 0
000900 2 C Trucking Co. Inc. 917-335-5555
09/19/89 .00 0 .00 .00 .00
0
.00 0 .00 .00 0
001000 The Electronics Group 917-555-4343
09/12/89 .00 0 .00 .00 .00
0 .00 0 .00 .00 0
001100 Dupont 818-454-2345
09/01/91 .00 0 .00 .00 .00
0
.00 0 .00 .00 0
001200 Castings Inc. 123-454-3434
04/28/92 .00 0 .00 .00 .00
0 .00 0 .00 .00 0
001300 Metals Inc. 345-765-6767
04/28/92 .00 0 .00 .00 .00
0 .00 0 .00 .00 0
001400 Metals and Plastics Inc 343-434-3434
04/28/92 .00 0 .00 .00 .00
0 .00 0 .00 .00 0
001500 Plastic Warehouse 243-454-4545
04/28/92 .00 0 .00 .00 .00
0 .00 0 .00 .00 0
001600 Commercial Plastics 343-434-2344
04/28/92 .00 0 .00 .00 .00
0 .00 0 .00 .00 0
0 .00 0 .00 .00 0
